Fair value gap (FVG)
The holes the smart money leaves behind, and how to tell which ones are worth it.
The fair value gap (FVG) is a hole in the market. Price moved so fast that it left behind an area where nobody really traded: an inefficiency. It is the trace the smart money leaves when it moves too fast.
The idea: the market looks for balance between buyers and sellers, and will ideally come back to fill that void before resuming its trend.
Bullish and bearish FVG
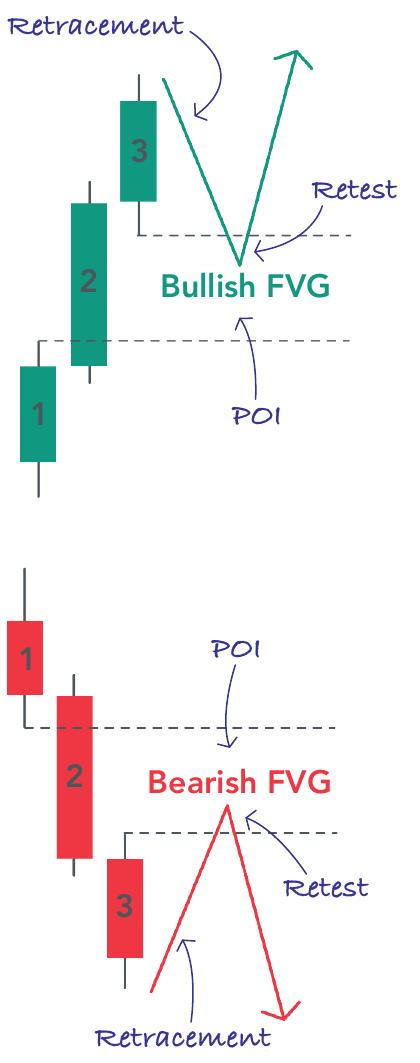
An FVG is defined by the missing overlap between three consecutive candles.
- The bullish FVG (+FVG) forms during a strong bullish push. It is the empty zone between the high of candle 1 and the low of candle 3.
- The bearish FVG (-FVG) forms during a strong bearish push. It is the empty zone between the low of candle 1 and the high of candle 3.
Spotting one on your chart
- Look at three consecutive candles, with a strong impulse in the middle one.
- Bullish: the low of candle 3 stays above the high of candle 1. Bearish: the high of candle 3 stays below the low of candle 1.
- Draw a rectangle between those two levels and extend it to the right.
- Mark the midpoint of the zone: that is your reference for judging how deep the retest goes.
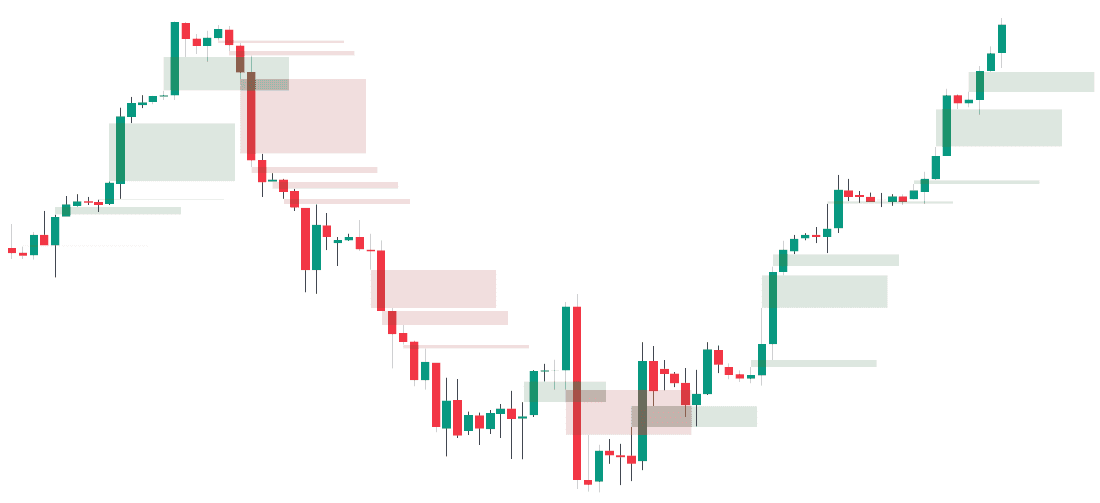
On any chart, you will find them everywhere. The real question is not spotting them, it is knowing which ones are actually worth it.
What an FVG tells you
FVGs are read as the signature of orders executed by the smart money. When you see one, something happened.
- 1A sign of strength or weakness: an FVG shows strong directional conviction, because the move was fast enough to leave a liquidity void behind it. Seeing FVGs in the direction of your trade is a good sign.
- 2A point of interest (POI): the FVG acts as potential support or resistance. The smart money often needs to bring price back into this zone, a retracement for a retest, to fill the inefficiency and execute the orders that couldn't be filled during the impulse, and to let latecomers in: institutional traders who couldn't execute their full size during the initial move get in at a better price.
Three criteria for a reliable FVG
Never use an FVG on its own; stack it with other concepts:
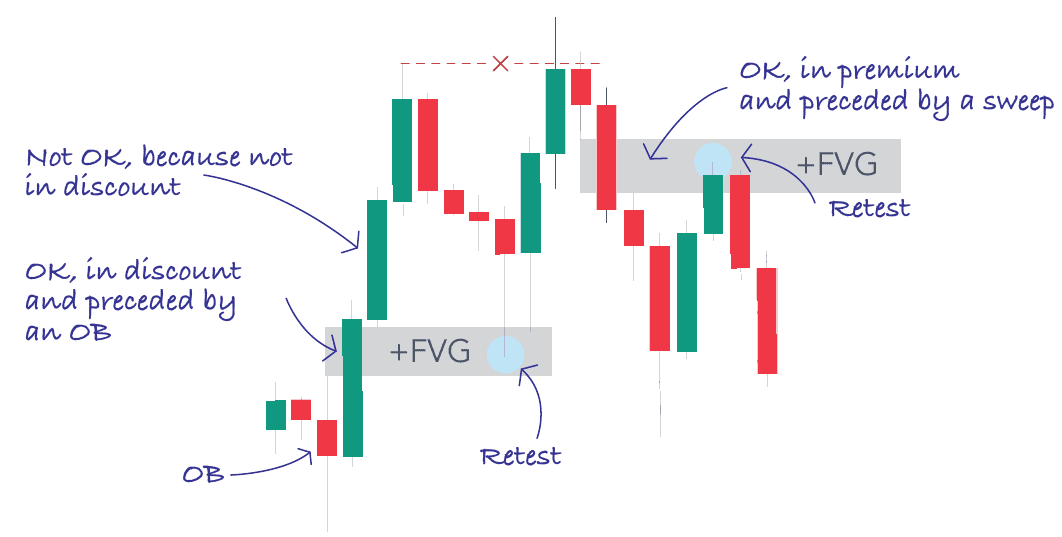
- Order block: an FVG right after a quality OB considerably increases the odds that it will hold.
- Liquidity sweep: an FVG that appears after a liquidity grab, such as relative equal highs or lows, is considered a strong signal.
- Premium and discount: use FVGs in the right context, a bullish FVG in discount and a bearish FVG in premium.
Mitigated and unmitigated FVG
An unmitigated FVG is intact: price hasn't touched it yet. That is the one you are interested in.
A mitigated FVG is one price has completely filled. Once fully traded through, it loses its interest: move on.
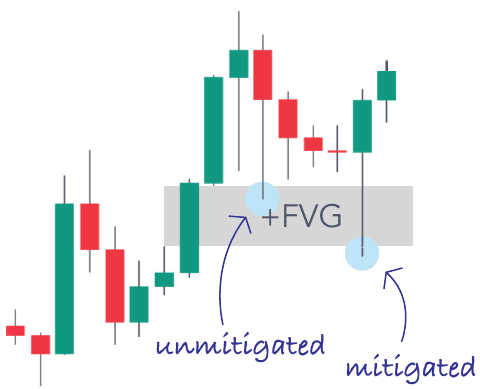
An important nuance: a partially touched FVG remains valid. Price can come back deeper into it as long as the zone hasn't been fully traded through, even if it is technically less clean.
Inverse FVG (iFVG)
When price trades all the way through an FVG, the zone switches sides. A former +FVG that has been traded through becomes resistance. A former -FVG becomes support. Same zone, reversed role: that is the inverse FVG.
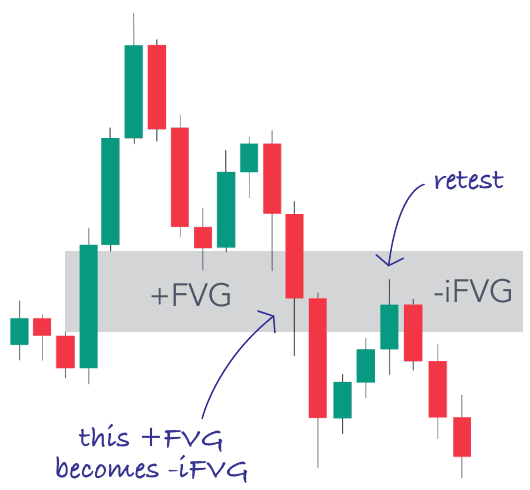
It is a useful signal, because it points to a shift in sentiment on that zone. Ideally, wait for a retest of the iFVG to confirm before entering. Exit if price closes beyond it.
Entries and stop loss
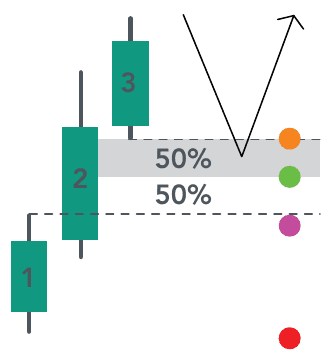
- Entry, option 1: at the edge of the FVG.
- Entry, option 2: inside the zone.
- Stop loss, option 1: below the FVG. Simple, but risky: a single wick or the spread can take you out.
- Stop loss, option 2: beyond candle 1. More conservative.
Watch this: a solid FVG shouldn't need to dig deep. Ideally, price doesn't go past the first half of the zone. The deeper it digs, the worse the sign. If price closes below your +FVG, or above your -FVG, exit the trade.
Not all FVGs are equal. Those created by the move that triggers an MSS, combined with other concepts, or formed on higher timeframes are more relevant (D1 > H4 > … > M1).
The rest is in the book
Beat the Market with SMT Divergences
These pages are the first part of the book. The rest answers the two questions that matter: which pair to trade, and when to enter.