Market structure
Reading a naked chart, with no indicators: highs, lows, trend and consolidation.
To determine the market's direction, and therefore whether to buy or sell, you need to be able to read a chart and the story it tells. While others use a collection of indicators such as RSI, MACD or Ichimoku to figure out where they stand (!), all you need is what follows to know whether the bears or the bulls are in control.
As you know, an asset doesn't move in a straight line but in a zigzag. Every price move forms a sequence of highs and lows that reflects the trend and potential reversals.
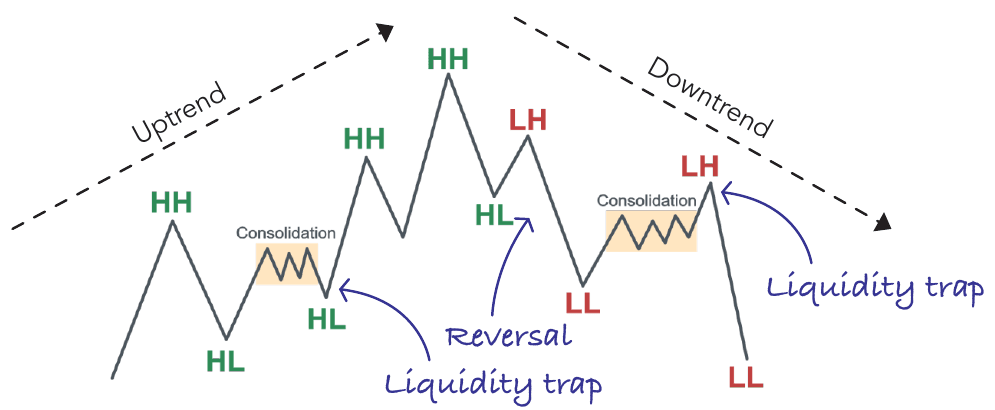
HH, HL, LH, LL
Here is each element of the diagram:
- HH, higher high: price reaches a high above the previous high.
- HL, higher low: price bounces from a low above the previous low.
- LH, lower high: price rises, but without reaching the previous high.
- LL, lower low: price drops below the previous low.
- Consolidation: structure can also contract without a clear direction, a sign of market indecision. Price then moves sideways. These phases often come before an impulsive move: the longer the consolidation, the stronger the move that follows.
By the way, consolidations also act as liquidity traps: price sometimes breaks out one way before violently reversing the other (see the stop loss page).
Spotting the end of a consolidation
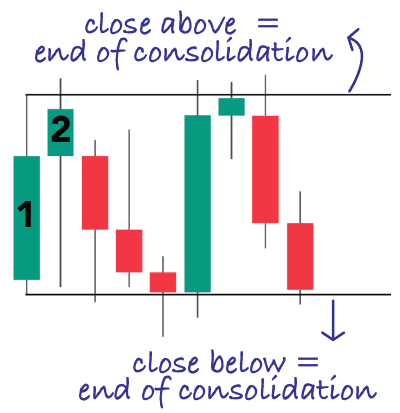
In a consolidation, no candle manages to close beyond the range of the first candle (or the first two). As soon as a candle closes above the upper boundary or below the lower one, it is the first sign that the consolidation is coming to an end.
The survival reflex
| What you see | Trend | What you do |
|---|---|---|
| A series of HHs and HLs | Bullish | Only look for longs |
| A series of LLs and LHs | Bearish | Only look for shorts |
| A consolidation | Market is undecided | Avoid trading |
Trading a consolidation is possible, but it is harder and takes more experience.
You should be able to read the trend in under 10 seconds. Align your trades with it, never trade against it. Bullish trend: only look for longs. Bearish trend: only look for shorts. Consolidation: turn off your computer, at least at first. Make it a rule and you will see your win rate improve.
The rest is in the book
Beat the Market with SMT Divergences
These pages are the first part of the book. The rest answers the two questions that matter: which pair to trade, and when to enter.